The year to 30 June 2016 was in many ways an extraordinary year with a range of both positive and negative influences at play. Regrettably for investors, the financial year concluded just as it started with considerable uncertainty and market volatility.
The year was a difficult one for investors
The year began with Greece centre stage (again) amid fears it could default on its loan obligations and attempt to leave the eurozone. Ironically, with Greece still in the eurozone, the year concluded with the United Kingdom’s electorate voting to leave. This has raised fears the ‘Brexit’ referendum outcome will set off a chain reaction elsewhere in the eurozone which could challenge its cohesion. So the financial year has concluded with greater complexity, uncertainty and risk.
The global economy has continued to advance through the year, thanks largely to the US, China and to a lesser extent Europe where growth has improved. However, other parts of the world struggled, particularly Japan and emerging economies like Russia and Brazil. China’s economic slowdown has continued, although its growth rate in absolute terms is still impressive compared to others. Nonetheless, it has led to a more circumspect assessment of the outlook for the global economy. Australia’s economy has performed reasonably well thanks to housing activity, however the states and sectors dependent on mining and energy are experiencing difficulties.
Accordingly, the assets that performed well were those perceived to be ‘safe havens’ or those providing income certainty such as global government bonds, gold, listed property and selected alternative investments. Most of our multi-asset portfolio returns were marginally positive for the year, which is a creditable outcome considering the volatility and the complex future that lies ahead.
It’s been a challenging year for share markets…
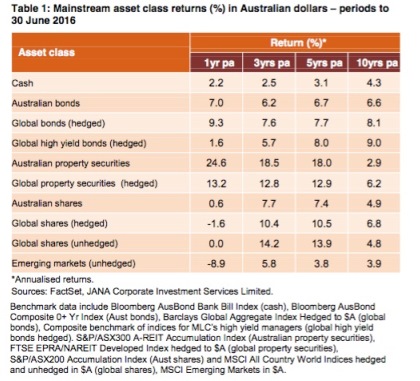
After three consecutive years of positive financial year returns, the global shares index recorded a negative return for the year. Japan’s share market was one of the worst performers. Japan’s Nikkei 225 Index declined 23% in local currency terms as the economy continues to perform poorly despite the Bank of Japan’s massive monetary stimulus program. Continuing evidence that Europe’s economic prospects are improving did little to assist European share markets. Share markets in Germany and France were down 11.6% and 11.5% respectively. Concerns late in the year that the UK’s Brexit result could be a catalyst for similar referendum outcomes in Europe and may ultimately threaten European unity, accentuated their losses. Ironically, the UK’s FTSE 100 Index fall in the year was only 0.3%. The relative strength of the US economy helped the US S&P500 Index gain 1.7% for the year.
The Australian dollar (AUD) was under pressure against most of the world’s major currencies as prices weakened for our major exports, in particular iron ore (-13.3%). The AUD fell 3.3% against the US dollar (USD) and was down 18.5% versus the yen and 3.0% versus the euro in the year. However, the AUD strengthened 14.2% against the UK’s sterling, due in part to the sterling’s weakness late in the year following the Brexit referendum result. For Australian investors, having an unhedged global shares strategy (where the value of the portfolio benefits from the AUD’s weakness) was marginally more beneficial. In the year to 30 June, unhedged global shares returned -0.05%, outperforming a hedged strategy which returned -1.6% in the same period. Although small, the impact of currency in a low return year should be welcomed by investors.
…and for emerging markets (again)
The disappointing return in the year reflects the difficult economic circumstances many emerging economies have experienced, particularly those reliant on the exports of commodities such as oil and minerals where prices have been weak. The US Federal Reserve (Fed) commenced raising interest rates in December 2015 which led to a withdrawal of capital from emerging markets, causing many emerging market currencies to weaken. This has created debt-servicing difficulties for those emerging economies that have borrowings in foreign currencies (usually USD). On a brighter note, India has continued on a positive path with solid demand and production indicators with moderate inflation.
Reality finally caught up with China’s share market, which fell heavily over the year. China’s financial volatility was particularly severe in 2015 in response to disappointing economic indicators, which prompted the Chinese authorities to intervene by suspending trade on a number of occasions. While not directly relevant to Australian multi-asset portfolios, China’s extreme market volatility did spill over into other share markets.
Australia’s share market outperformed global peers
Our market managed to record a small positive return for the year, outperforming many of its global peers. However, there were pronounced differences in industry sector performances. The sectors delivering the most robust return outcomes tended to be those with superior earnings momentum (Healthcare +21.5%) or higher dividend yields relative to cash, bonds and term deposits (Real Estate Investment Trusts, +24.6%, Utilities +24.5%). By contrast, the major banks underperformed due to substantial capital raisings during the year and investor concerns about the outlook for bank earnings and their ability to maintain dividends if higher bad debt provisioning is required. Resource and Energy company performances were also weak as lower commodity prices (Iron ore -13.3%, Oil -21.3%) negatively impacted profits and dividend payouts.
Lower bond yields worldwide…
Bonds rallied strongly around the globe over the last year with yields continuing to fall as bond prices rose, resulting in good returns for investors. Falling inflation expectations (helped by the lower oil price), a less aggressive approach by the Fed to the size and timing of rate rises, diminishing global growth expectations and a continued preference by investors for safe havens were factors that drove prices higher and yields lower, particularly for government bonds. For example, the yield on US Treasuries reached record lows not seen since 1946, with 10 year treasuries falling from 2.30% to 1.40%. Australian government 10 year bonds fell from 2.93% to 1.93%. The yield on 10 year German government bunds fell into negative territory (-0.15%) for the first time ever. Japanese 10 year bonds fell from 0.45% to a negative -0.27% yield. Unconventional monetary policies continue to be explored by central banks with Japan and Europe using negative rate structures as the latest tool to reinvigorate their economies. The economic success of such policies continues to be questioned but the impact on the value of traded financial assets is unquestionable.
In contrast, the pricing of non-investment grade bonds such as emerging markets debt and some corporate issuers were volatile. This was due in part to investor concerns of default risk by energy related high yield issuers exposed to the oil price collapse. Returns from the high yield sector, whilst positive for the year, were uncharacteristically low compared to recent years.
Global economic conditions were reasonable, including Australia’s, but…
While the global economy as a whole managed to advance over the year, economic fundamentals were far from robust. Global growth forecasts were subject to downward revision as the year progressed. This was due in part to China’s lower growth and a growing acceptance that the best of the US growth cycle has already occurred, even though the US economy continues to perform well.
A significant drag on global growth was the Japanese economy which, despite massive monetary stimulus by the Bank of Japan, continues to struggle. Business confidence has been soft while inflation pressures have faded with the stronger currency. The earthquake in mid-April has also weighed on activity. Looking ahead, a government budget stimulus program in addition to ongoing monetary stimulus will be necessary to improve growth.
A bright spot has been the gradual improvement of the eurozone economy. Growth has picked up and Europe’s unemployment rate fell to 10.2% in April, the lowest jobless rate since 2011. However price pressures in Europe remain sedate with annual inflation near 0% and well below the central bank’s 2% inflation target. Accordingly, the European Central Bank (ECB) has maintained their policy stimulus program of negative deposit interest rates and asset purchases.
Australia’s economic performance has been reasonably robust considering we are well past the peak of the mining capital spending cycle which helped cushion our economy from the worst of the global financial crisis (GFC). The economy grew 1.1% in the March quarter, bringing the annual growth rate to 3.1%, the highest growth reading for three and a half years. Strong growth in consumer spending, housing construction and exports have helped offset the downturn in mining investment. The lower AUD has also been beneficial. While the annualised growth rate is pleasing, conditions vary throughout the nation with mining and energy based states such as Western Australia and Queensland lagging. Compared to overseas monetary authorities, the Reserve Bank of Australia (RBA) still has policy flexibility with the cash rate at 1.75% should the economy require help.
…monetary stimulus remained necessary in many parts of the world
Many central banks have been required to maintain or extend pre-existing quantitative easing programs to support their economies and encourage growth. Aside from massive on-going bond purchases, interest rates have been pushed to extraordinarily low levels. The necessity for these measures has been greatest in Europe and Japan where their central banks have been pursuing unorthodox monetary policies such as negative deposit rates. For example, the ECB now charges commercial banks a negative interest rate of -0.4% on funds they deposit. As an indication that market conditions are far from normal, 40% of European government debt on issue is providing those bond holders with a negative yield. In Japan, 75% of Japanese government debt on issue are paying a negative yield.
Monetary policy initiatives in Europe which have weakened the euro have had some beneficial impact. Eurozone unemployment has fallen from GFC highs and growth conditions continue to show modest signs of improvement. However, inflation hovers close to zero and deflation concerns prevail. In Japan, there is little to show for its massive monetary stimulus. As a result, markets have become increasingly concerned that Japanese policy makers are running out of ideas and are questioning the effectiveness of the levers remaining at their disposal.
China has been responding to slower economic growth with the People’s Bank of China cutting interest rates to encourage credit growth and beginning to implement the initial stage of bank lending reforms.
As expected, monetary policy in the US diverged from the rest of the world. The Fed decided to begin raising interest rates in December 2015. Overall, markets responded favourably to the move as it signalled confidence in the economy’s growth prospects. Markets were also reassured by the Fed’s assurances of “gradual” interest rate rises to maintain the economy’s growth path.
Locally, the RBA was forced to act by lowering the cash rate by 0.25% to 1.75% in May in response to the very low March quarter inflation data. Australia’s inflation rate of 1.3% is well below the RBA’s 2%-3% target. Compared to central banks elsewhere in the world where official interest rates are close to zero or in negative territory, the RBA still has some monetary policy ammunition available to it should the Australian economy need a helping hand.
Overall, a “defensive” portfolio stance has been maintained, especially as the outlook continues to be uncertain
For some time now, we have believed it is appropriate to be defensively positioned where possible in our MLC Horizon and Inflation Plus portfolios. We have been concerned that the ultra-accommodative monetary policy that has been pursued in many parts of the globe has been the main driver of markets, not economic fundamentals. As a result, market valuations have looked stretched and expensive.
The recent decision by the UK to exit the European Union is symptomatic of a world where there have been considerable risks. Risk management has been uppermost in our minds for some time. Well before the Brexit vote, our portfolios had a defensive bias, particularly in the MLC Inflation Plus portfolios because of their asset allocation flexibility. Our defensive positioning is a function of multiple significant risks, notably the continuing excessive level of debt in a number of countries, complacent market pricing, lacklustre economic performance despite extreme monetary policy settings, as well as limited room for policy manoeuvre in response to shocks.
This defensiveness has been achieved in a number of ways. We have lowered our exposure to Australian shares. Our portfolios are holding more cash than is normal, including those managers we have appointed who have the discretion to hold cash to manage risk. For our MLC Horizon and Inflation Plus portfolios, we have increased the allocation to alternative strategies which we believe will help preserve investors’ capital in volatile markets and provide potentially better returns for the level of risk we take. More recently, we have taken steps to hedge the risk of a rise in the AUD in our multi-asset portfolios. We also remain very selective on the type of fixed income we own in our portfolios.
While these positions may not prevent negative returns in the current market conditions, our caution should be providing a degree of insulation.
How does MLC deal with uncertainty?
At MLC, we focus strongly on risk management. We believe managing risk for our investors is at least as important as generating returns for them – and in this unpredictable investment environment, it’s more critical than ever.
As a result, we design and manage our multi-asset portfolios to be resilient in a wide range of possible market conditions. Using our market-leading investment approach, we constantly test how our multi-asset portfolios are likely to perform in many potential market scenarios, both good and bad. We can then adjust our portfolios to manage possible risks and take advantage of potential return opportunities.
This careful analysis means our portfolios are widely diversified, risk-aware and positioned for many market environments.
Important information
This communication is provided by MLC Investments Limited (ABN 30 002 641 661, AFSL 230705) (MLC), a member of the National Australia Bank Limited (ABN 12 004 044 937, AFSL 230 686) group of companies (NAB Group), 105–153 Miller Street, North Sydney 2060.
This information may constitute general advice. It has been prepared without taking account of an investor’s objectives, financial situation or needs and because of that an investor should, before acting on the advice, consider the appropriateness of the advice having regard to their personal objectives, financial situation and needs.
You should obtain a Product Disclosure Statement (PDS) relating to the financial product mentioned in this communication issued by MLC Investments Limited, and consider it before making any decision about whether to acquire or continue to hold the product. A copy of the PDS is available upon request by phoning the MLC call centre on 132 652 or on our website at mlc.com.au.
An investment in any product referred to in this communication is not a deposit with or liability of, and is not guaranteed by NAB or any of its subsidiaries.
Past performance is not a reliable indicator of future performance. The value of an investment may rise or fall with the changes in the market. The returns specified in this communication are reported before management fees and taxes.
Any opinions expressed in this communication constitute our judgement at the time of issue and are subject to change. We believe that the information contained in this communication is correct and that any estimates, opinions, conclusions or recommendations are reasonably held or made as at the time of compilation. However, no warranty is made as to their accuracy or reliability (which may change without notice) or other information contained in this communication.
This information is directed to and prepared for Australian residents only.
MLC may use the services of NAB Group companies where it makes good business sense to do so and will benefit customers. Amounts paid for these services are always negotiated on an arm’s length basis.
Bloomberg Finance L.P. and its affiliates (collectively, “Bloomberg”) do not approve or endorse any information included in this material and disclaim all liability for any loss or damage of any kind arising out of the use of all or any part of this material.
The fund referred to herein is not sponsored, endorsed, or promoted by MSCI, and MSCI bears no liability with respect to any such fund.